
Ethereum price holds above $2,000 as open interest surpasses $21 billion, signaling potential bullish momentum for April 2025.
Ethereum Holds Above $2,000 as Bears struggle to Regain Control
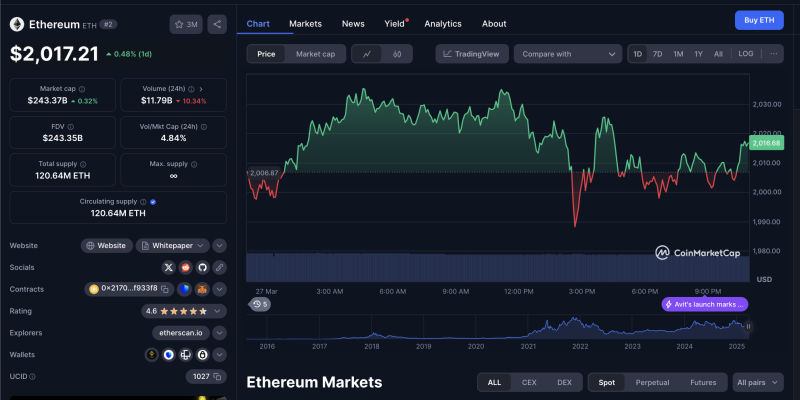
Ethereum (ETH) maintained its position above the $2,000 mark on Monday as traders rotated capital into low-cap altcoins and memecoins.
Despite a 4% downtick on Thursday, ETH open interest remains above $21 billion, signaling sustained market participation. Meanwhile, a key $4 billion resistance cluster has emerged around $2,220, according to Ethereum’s 30-day liquidation map.
Ethereum Price Analysis | ETHUSD
After spending much of last week consolidating below $2,000, ETH spot markets saw renewed demand on Monday.
The combination of a Federal Reserve rate pause and slowing inflation contributed to a positive start to the week across crypto markets. However, ETH has struggled to decisively break the $2,100 resistance.
As of Thursday, March 27, Ethereum was trading at $2,065, down 2% on the day. On the upside, ETH price has now remained above $2,000 for three consecutive days, reflecting a widespread intent to hold as the market anticipates the next major catalyst.
ETH derivatives signals suggest further gains in April 2025
Although ETH has yet to break past the $2,100 barrier, derivatives market data indicates that bullish sentiment is building. Key metrics suggest a potential breakout as April 2025 approaches.
Coinglass‘ Open interest chart, which tracks the total capital locked in active futures contracts, has been on a steady rise since mid-March. This trend aligns with the release of U.S. CPI data showing slowing inflation, which boosted investor confidence.
Ethereum Open Interest, March 2025 | Source: Coinglass
Ethereum’s open interest dropped to a weekly low of $17.3 billion on March 10 but has since rebounded significantly. Speculative traders have been injecting fresh capital into ETH futures markets, signaling renewed confidence.
As of Thursday, ETH open interest stands above $21 billion, reflecting a $4 billion increase in just three weeks. This influx of capital suggests that traders are positioning for further upside in April, potentially setting the stage for a bullish breakout.
Ethereum liquidation map signals a battle between $1,950 support and $2,050 resistance
Beyond open interest, Ethereum’s 30-day liquidation map highlights another key factor supporting a bullish outlook. This map tracks the total leverage deployed at critical ETH price levels, offering insight into potential price movements.
Currently, ETH bulls have committed $3.3 billion in active long positions, compared to $2.95 billion in short positions. This creates a $3.05 billion long-side advantage, reflecting a 10% dominance over bearish traders. The data confirms that the majority of active traders in Ethereum’s derivatives markets are leaning bullish.
Ethereum price forecast: Major resistance at $2,100 could dictate next breakout
Despite the bullish sentiment, Ethereum’s liquidation map reveals leverage clusters that could impact price movements in the coming days.
On the bearish side, $1,974 remains a critical support level, with $486 million in leveraged positions concentrated at that price. If ETH price drops below this level, cascading liquidations could send prices toward the next major support at $1,864, where traders have deployed $2.37 billion in leverage.
Ethereum Open Interest, March 2025 | Source: Coinglass
On the bullish side, resistance at $2,037—where $203.6 million in leveraged short positions is concentrated—poses the first challenge.
A sustained close above this level could pave the way for a breakout toward $2,110, where the largest bearish cluster of $1.25 billion sits. Overcoming this resistance could set the stage for ETH to test the $2,500 range as April 2025 approaches.
The post What Does $21.6 Billion Open Interest Mean for Ethereum Price Prediction in April 2025? appeared first on CoinGape.


